Examining Transporation Numerical Data Using Excel Formulas
TL;DR
Using functions in Excel like AVERAGE(), PERCENTILE.EXC() and UNIQUE() to calculate summary statistics and examine data values can help with the manual analysis of numerical columns riddled with non-numerical data.
Transport Log Data

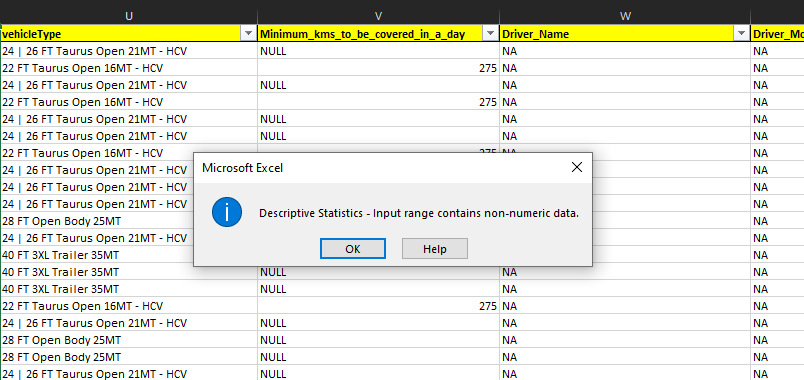
Creating data tables in Microsoft Excel makes it easy to run all kinds of analysis. With the click of a button, Excel wizards take input from interesting columns and generate the desired output, such as descriptive statistics. In cases when the standard one-click analysis does not work, for example when using missing or dirty data, Excel makes it easy to do manual analysis using formulas.

Using an excerpt from the above transportation data found on Kaggle.com, focusing on the descriptive statistics of the data really involves two columns: TRANSPORTATION_DISTANCE_IN_KM and Minimum_kms_to_be_covered_in_a_day.
Summary Statistics
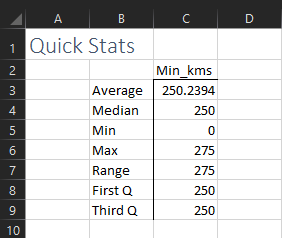
Starting with the V column, Minimum_kms_to_be_covered_in_a_day, I find the average, or mean, measure of central tendency.
=AVERAGE(Database!V:V)
In a similar fashion, I call the V column to perform the following functions:
=MEDIAN(Database!V:V)
=MIN(Database!V:V)
=MAX(Database!V:V)
I then subract the minimum from the maximum to get the range.
=C6-C5
Finally, I use the following formulas to find the first and third quartiles.
=PERCENTILE.EXC(Database!V:V, 0.25)
=PERCENTILE.EXC(Database!V:V, 0.75)

These descriptive statistics yield some interesting insights:
- The smallest value of the Minimum_kms_to_be_covered is 0, which could mean either no travel was expected on some bookings, or any number of miles traveled on a trip above 0 was accepted. This is an interesting scenario for management and probably worth more examination.
- Since the maximum value of 275 is so close to the average and median, more values should be expected of higher range.
- The first quartile = third quartile = 275. This is most unusual for numeric data.
Using UNIQUE() to Identify Values
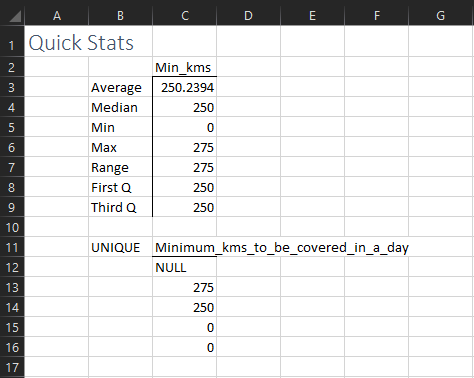
To understand the kinds of values in the column, I use the UNIQUE() function to list all the possible values.
=UNIQUE(Database!V:V)

The only values used under the column Minimum_kms_to_be_covered were:
- NULL
- 275
- 250
- 0
- 0
Therefore, this column should be treated as a discrete variable, which are better examined using frequency charts and tables.
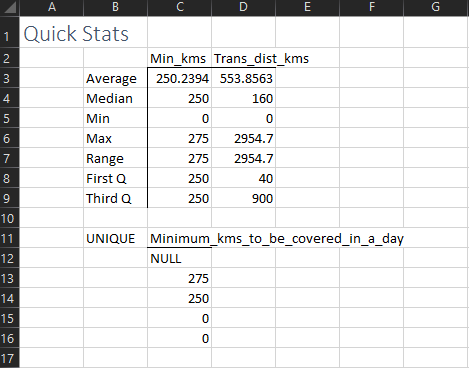
Luckily, running the same process on the other numerical column TRANSPORT_DISTANCE_IN_KM does provide useful summary statistics.

Conclusion
Numerical data is lovely to work with when its squeaky clean, but often the art of exploration is limited or expanded by the number of tools in one’s toolkit. Numerical data is entered under many circumsances and may not always fit the frame we expect; it’s important to have several ways of exploring the data. Other avenues for investigating the above data could be using filters, pivot tables, and charts in Excel.
